To graphically represent a function, we use the system of Cartesian axes in which the values of 2 variables can be represented: the independent variable $$x$$ in the abscissa axis, and the dependent variable $$y$$ in the ordinates axis.
The graphic representations can be of integer variable, rational variable or real variable, according to the numerical sets every function works with.
The procedure to follow in order to represent graphically a function when we have its algebraic expression is:
- Considering the function $$y = f (x)$$, we create a table of values with different points $$(x, y) = (x, f (x))$$
- We represent the points obtained in the axes of coordinates.
- We join the represented points drawing, in this way, the graph of the function.
Later, we will learn more ideal and precise ways of representing a function, since for those cases in which the form of the function is not known we will need too many points to have an exact idea of the behavior of the function. Also, we will see that the number of necessary points to be able to represent a function depends on the function, and with time and practice we will learn that choosing the proper points only a few of these are necessary.
Let's see now a couple of examples:
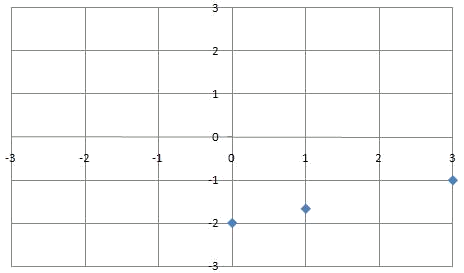
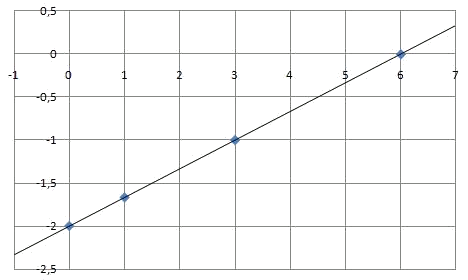
Represent graphically the function $$\displaystyle y=\frac{x}{3}-2$$
We start by calculating a table of values:
| $$x$$ | $$y = f (x)$$ |
| $$0$$ | $$\displaystyle y=\frac{0}{3}-2=-2$$ |
| $$1$$ | $$\displaystyle y=\frac{1}{3}-2=\frac{-5}{3}$$ |
| $$3$$ | $$y=\displaystyle \frac{3}{3}-2=-1$$ |
| $$6$$ | $$\displaystyle y=\frac{6}{3}-2=0$$ |
| ... | ... |
Therefore, we have the points:
| $$x$$ | $$y$$ |
| $$0$$ | $$-2$$ |
| $$1$$ | $$\displaystyle \frac{-5}{3}$$ |
| $$3$$ | $$-1$$ |
| $$6$$ | $$0$$ |
That we can represent in the coordinates axes.
And if we join them, we get the graph of the function:
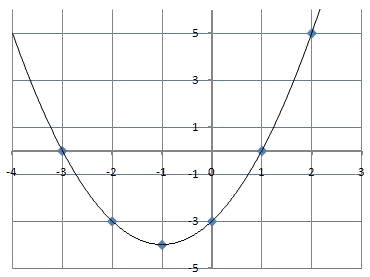
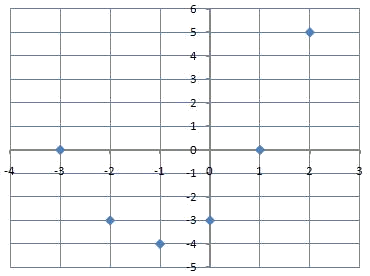
Let's represent now the function $$y=x^2+2x-3$$. As in the previous case, we start by calculating a table of values:
| $$x$$ | $$y = f (x)$$ |
| $$0$$ | $$-3$$ |
| $$1$$ | $$0$$ |
| $$-1$$ | $$-4$$ |
| $$2$$ | $$5$$ |
| $$-2$$ | $$-3$$ |
| $$-3$$ | $$0$$ |
That we can represent graphically:
And then join them to obtain the graph of the function: