Considering a function $$f(x)$$ defined as $$$ \begin{array}{rcl} f: X & \longrightarrow &Y \\ x &\longmapsto & f(x)=y \end{array} $$$
we define the graph of this function as the set of points: $$$ \{ (x,y)\in X\times Y \ | \ y=f(x) \} $$$ or also the pairs of points $$(x,f(x))$$. These points can be represented with the Cartesian coordinates in the plane $$XY$$ obatining the graph of the function $$f(x)$$.
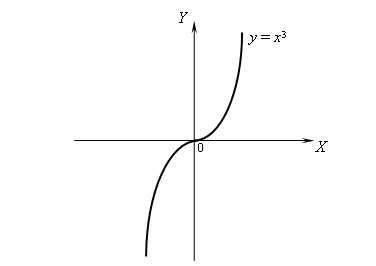
Let's take the function $$f(x)=x^3$$. Its graph will be given by the set of points $$ \{ (x,f(x))\}=\{(x,x^3)\} $$ when varying the value of $$x$$.
If we represent it we obtain the drawing:

But, how is a graph represented? To be able to explain this we must first introduce the concept of domain and image of a function.
In a function $$f(x)$$ we distinguish two sets: one is the set from which we take values to evaluate the function (the possible values of $$x$$) and the other one is the set given by the different values that reaches the function $$f(x)$$.
Then, we define:
- Domain of a function is the set of values where we will evaluate the function. It is denoted as $$\text{Dom}(f)$$.
- Image of a function is the set of values the function takes. It is denoted as: $$\text{Im}(f)$$.
Notice that when we have a function like
$$$ \begin{array}{rcl} f: X & \longrightarrow &Y \\ x &\longmapsto & f(x)=y
\end{array} $$$
the set $$X$$ is the domain, since we will take the values of $$x$$ and the image is inside the set $$Y$$.
Let's see it with some examples:
The domain of the function $$f(x)=x$$ is the whole real line, since we can evaluate it at any point, and it takes the same line as the image, since this function is the identity.
We will write:
$$\text{Dom}(f)=\mathbb{R}=(-\infty,\infty)$$
$$\text{Im}(f)=\mathbb{R}=(-\infty,\infty)$$
The domain of the function $$f(x)=x^2$$ is also the whole real line (we can evaluate it at any point) and, however, when raising to the square, we only obtain positive values. Consequently, its image will be the positive part of the real line including the zero.
Therefore we will write:
$$\text{Dom}(f)=\mathbb{R}=(-\infty,\infty)$$
$$\text{Im}(f)=[0,\infty)$$
We can observe that the domain can be a set selected by ourselves (since we can choose it to be smaller or bigger) while the image will be given by the selected domain.
Sometimes, however, we might find that our function is not defined at certain points and therefore it cannot be evaluated in all the domain, so we will have to exclude certain points or intervals of the domain.
Per exemple:
If we take the function $$f(x)=\dfrac{x+1}{x}+1$$ we can see that when $$x = 0$$ we have the expression $$\dfrac{1}{0}$$ then this division cannot be done.
Consequently, the domain of this function will be all the real line except zero:
$$\text{Dom}(f)=\mathbb{R}\setminus\{0\}=(-\infty,0)\cup(0,\infty)$$
And the image will be:
$$\text{Im}(f)=\mathbb{R}\setminus\{1\}=(-\infty,1)\cup(1,\infty)$$
Domains calculation:
To calculate the domain of a function we first have to think that any number of the real line ($$\mathbb{R}$$) is possible, and then start restricting the set depending on the function. To do these restrictions we must indentify the "weak" points of our functions or rather, the non defined points. Next we list the sets where some main functions are not defined:
| Function | Set of non definition |
| $$f(x)=\log(g(x))$$ | $$\{x \ | \ g(x) \leqslant 0 \} =$$ the values of $$x$$ such that $$g (x)$$ is zero or negative |
| $$f(x)=\sqrt{g(x)}$$ | $$\{x \ | \ g(x) < 0 \}=$$ the values of $$x$$ such that $$g (x)$$ is negative |
| $$f(x)=\dfrac{g(x)}{h(x)}$$ | $$\{x \ | \ h(x)=0 \}=$$ the values of $$x$$ such that $$h(x)$$ is zero |
| $$f(x)=\sqrt[2n]{g(x)}$$ | $$\{x \ | \ g(x) < 0 \}=$$ the values of $$x$$ such that $$g(x)$$ is negative |
If we take the function $$f(x)=\Big( \dfrac{2x+1}{x-4}-\ln(x+8)\Big)\cdot\sqrt{x^2+1}$$ and we want to find its domain, we first must think that it is the whole real line and then restrict it as we identify points or intervals where the function is not defined.
In this case, we observe that we have 3 possible intervals:
- when $$x-4$$ is zero $$\Rightarrow x-4=0\Rightarrow x=4 \ $$ the function is not defined
- when $$x+8$$ is negative or zero $$\Rightarrow x+4 \leqslant 0 \Rightarrow x\leqslant-8 \ $$ the function is not defined.
- when $$x^+1$$ is negative $$\Rightarrow x^2+1< 0 \Rightarrow x^2< -1 \ $$, and this cannot happen since $$x^2$$ is always positive, therefore the function does not have any problems in this part.
Then, we can conclude that the domain of our function will be: $$$ \text{Dom}(f)=(-8,4)\cup(4,\infty)$$$
Graphic representation
Let's suppose that we have a function $$f(x)$$. To represent it graphically we first have to find its domain to know the points where we must evaluate the function.
As soon as the domain is found we will proceed with the representation. How to do it? Well, the easiest and simple way is by tabulating some values, or in other words, we will assign different values to the variable $$x$$ and we will find the value of $$f(x)$$ then, we will draw these points $$(x,f(x))$$ in the plane using the Cartesian coordinates.
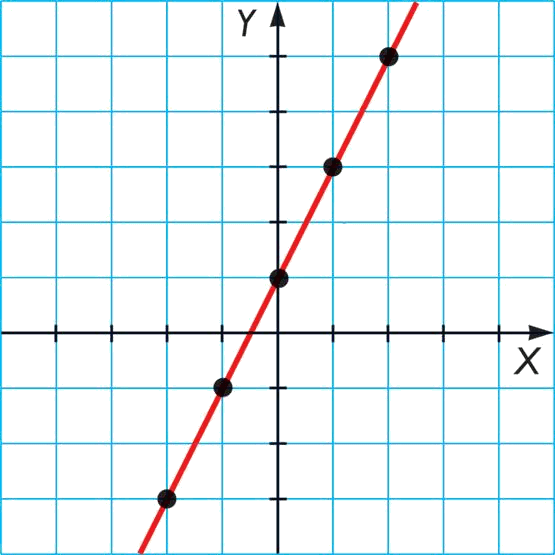
Let's take the function $$f(x)=2x+1$$ and we are going to do table:
| $$x$$ | $$f(x)$$ |
| $$-2$$ | $$f(2)=2\cdot(-2)+1=-3$$ |
| $$-1$$ | $$f(2)=2\cdot(-1)+1=-1$$ |
| $$0$$ | $$f(2)=2\cdot(0)+1=1$$ |
| $$1$$ | $$f(2)=2\cdot(1)+1=3$$ |
| $$2$$ | $$f(2)=2\cdot(2)+1=5$$ |
Therefore we obtain the following points:
| $$x$$ | $$f(x)$$ |
| $$-2$$ | $$-3$$ |
| $$-1$$ | $$-1$$ |
| $$0$$ | $$1$$ |
| $$1$$ | $$3$$ |
| $$2$$ | $$5$$ |
we will then draw them in the plane $$XY$$ and will join them with a line. Finally we obtain:

where the black points are the values in the table.
This procedure (doing the table) can be very useful when we must draw a function, but sometimes might not be useful, since very different functions exist and little time is needed to only find a few points to be able to draw the function.
